
Map of the Week: Here Be Dragons, or How to Make Adventure Maps


When we talk about maps in our present we often forget the intrepid legacy of mapmaking in our past. Some subtle reminders of the struggles behind our geographic sensitivities still hold strong; names like "Mercator" and "Coronelli" echo in our projections and account plans at CartoDB but rarely do contemporary cartographers think about our own maps as being particularly pioneering or the product of an adventure.

This week's featured mapper still holds to the epicness of exploratory maps. Anthony Goddard runs a small project called ZeroSixZero which builds custom realtime tracking maps for expeditions and adventurers. Read on to learn how he makes maps that track the trails of post-modern pioneers!
We forget with the navigatory-ease of slippy maps that the making of a mappa mundi was once a non-trivial operation requiring exploration and often adventure. Do we remember a time when sea monsters marked coordinates of whole continents? Not really. Or can we recall a time when frontiers were defined not only by political imposition but by the mythology of a terra incognita? Unlikely. But can we comprehend the epic trail of an adventure as it plots on our self-made map-sterpieces? Possibly.
That's what Anthony Goddard's work is all about and in this week's post we invite him to share some of the narratives he builds in maps!
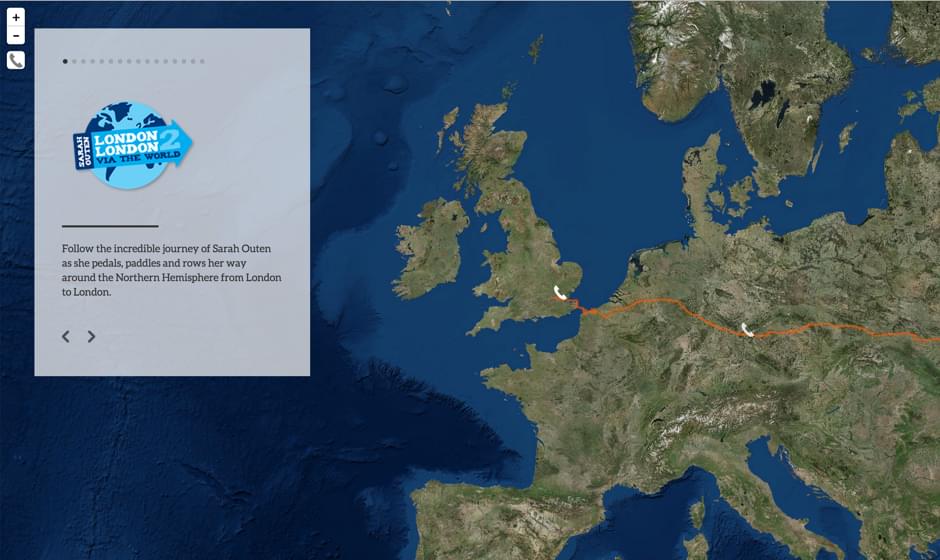
London2London
In 2011 at the age of 25 Sarah Outen hopped in a kayak and began paddling down London's River Thames. There were other kayaks in the Thames that day but whereas most people were out for a leisurely spring-time paddle Sarah had other plans. Sarah like the other paddlers was paddling back to shore in London. Unlike the other paddlers she was taking a detour first - via the rest of the world.
Odyssey
When I came across Sarah's expedition I was blown away by the scale of it and contacted her to ask if she would be interested in sharing the data which she kindly agreed to. I added all of Sarah's historical tracking data to CartoDB and then data in hand set about finding the best way to visualize it. Sarah already had a basic and functional map on her website and I didn't want to just replace that map for her I wanted to make it way better.

I've worked on many maps from Ocean rowers to record breaking athletes and even folks unicycling the world!
Here's another tracking Anna McNuff's [run through the length of New Zealand]:
Most of these maps follow a general pattern - a GPS linestring a marker and perhaps some statistical overlays or progress markers / popups. Sarah's expedition was so big that I didn't feel that any of these formulae could really convey the scale of it. By the start of 2015 when I began work on her map Sarah had already cycled across Europe and Asia rowed across the Pacific kayaked the Aleutian Islands and was now cycling across Noth America. As she was making her way across the country I came across Odyssey.js a project by CartoDB for telling interactive stories with maps and I knew I had found my answer to Sarah's map.
The Data
I had been continually syncing data from Sarah's tracker to CartoDB so I had all the data I needed. Sarah's journey consisted of a number of segments and I wanted the viewer to easily differentiate between them. To do this I added a category field for each position and based on the timestamp of the position allocated a route name as the category. I then used a category line style in CartoDB to render a color for each category. For the latest position I uploaded an image of Sarah's boat which would show her on her next leg rowing the Atlantic. With this visualization complete I added the viz.json link to Odyssey.js and then began writing the story. Odyssey allows you to write with simple markdown a story with embedded coordinates and allows the user to travel to these key places and times while reading the story.
Sarah had also been recoding "phonecast" updates on her satellite phone for the expedition and by screen scraping data from her blog posts and then using additional javascript in the Odyssey map I was able to add these phonecasts as an optional layer in the map allowing the viewer to hear what it was like along the places shown in the odyssey map in Sarah's own voice.

Cartodb.js
With the challenge of showing the history of the expedition solved I then needed to design a map to show Sarah's realtime progress on the current final leg of her expedition. The realtime map would add things like weather overlays and additional metadata for positions along the route as well as up to date telemetry from Sarah's tracker.

To do this I switched to Cartodb.js. On Sarah's tracking site users are shown both maps allowing them to switch between historical and realtime information. The weather overlays are provided by OpenWeatherMap and loaded using Leaflet tilelayers and a control layer as follows:
{% highlight js %}
var sea_surface_pressure = L.tileLayer('http://{s}.tile.openweathermap.org/map/pressure_cntr/{z}/{x}/{y}.png' {
attribution: 'Map data ©
'
opacity: '0.5'
});
var wind = L.tileLayer('http://{s}.tile.openweathermap.org/map/wind/{z}/{x}/{y}.png' {
attribution: 'Map data ©
'
opacity: '0.3'
});
var overlayMaps = {
"Sea Surface Pressure": sea_surface_pressure
"Wind": wind
};
L.control.layers(null overlayMaps {collapsed:false}).addTo(map);
##_END_REPLACE_ME_PRE_##
Mapping Adventures
CartoDB with tools like OdysseyJS and CartodbJS has made it possible to build tracking maps that are highly customized for each adventure adding data and context that previously wasn't possible with off-the-shelf tracking solutions. Oftentimes the only mechanism for people to follow expeditions is blog posts and maps. My goal with ZeroSixZero is to allow the viewer to feel as close as they can to the adventure they're following and push the boundaries of adventure mapping.
If you'd like to view more of Anthony's maps check out his public profile tweet him @anthonygoddard or contact him via ZeroSixZero.
Stay tuned for our next Map of the Week feature and meantime happy mapping !
