Rapidly Render Data Maps with CartoDB's Data Overviews


When visualizing on a map tens of thousands or millions of points in a dataset data points may be spread all around the world or be confined to a single country region city or even some smaller area. In any case there will be a zoom level in which the whole dataset is represented in a single 256x256 pixel tile. The "great mother of all tiles" tile 0/0/0 will inevitably have to show the whole collection of points.
Rendering all the points in that tile is not only a tough task but it isn’t optimal at all. Moving all that data will take quite some time and drawing it will be a daunting task. If it does get completely painted most of the work will be useless because you cannot possibly depict millions of features in a 256x256 pixel grid -- many features will be stacked on top of others occluding them.
Of course some children of that tile will also be packed with too-many features so we will have similar problems at higher zoom levels. Eventually we may get to a zoom level where the features have spread so much that each tile gets only a few features per tile rendered efficiently. That was one of the main obstacles to visualizing huge amounts of data. Today we have put some techniques in place at CartoDB to circumvent this problem all with a click - or an sql function if you are brave enough.
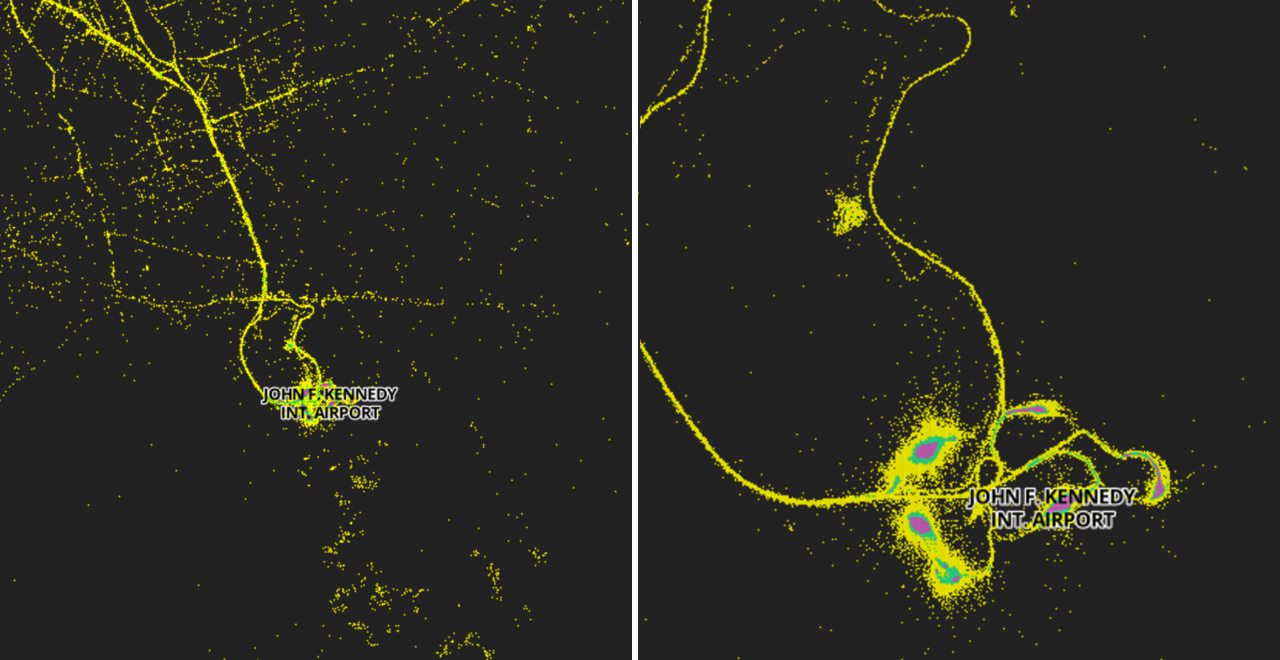
Take a look at the map below. We’ve imported NYC Taxi pick-up data (over 13 million rows) into CartoDB and styled it in a way that streets and buildings are almost unnecessary.
Now when you import a large dataset it will be analyzed to determine at which zoom level tiles can be densely packed with features. Then for that level and all levels lower than its reduced version of the dataset ('overviews') are constructed containing fewer features as to avoid overloading the tiler.
The way the number of features is reduced is by aggregating them into "overview-features" that represent many of the original features and have aggregated values for their attributes. This aggregation is done so that at most one feature will be located at each of the tile's pixels which both limits the maximum number of features the tile will have to deal with and also maintains
the original visual aspect of the tile (since all the discernible positions in the tile are used).
The process is repeated for all smaller zoom levels so that we have for each one a reduction of the data targeted to the level's tile size. This allows the dataset to be represented without substantial changes in its aspect efficiently. Take a look at how easy it is to identify hotspots of data such as airports.
And don’t worry about your columns. We've chosen to average numeric quantities over all the features that are represented in a single point. For text attributes the multiple values aggregated are shown only if there are only a few otherwise there's no efficient way to handle them so an asterisk (*) is used as a placeholder to show that multiple different values of the attribute exists at the location. On the other hand sometimes numerical or textual attributes represent discrete categories rather than a continuum of possible values. In this case the aggregation methods mentioned are not useful. When building overviews the columns for which a few different values seem to exist are handled differently and it is the 'mode' (most frequent value) which is stored as the aggregate value for the attribute.
Rendering and viewing all the features in a single tile from a large dataset no longer has to be a pain. With Data Overviews you can derive the necessary insights you need without compromising your data. This is a big step towards a platform where location intelligence can be done out of the box no matter how much data needs to be handled.
Please don't hesitate in [contacting us](mailto: support@cartodb.com) if you have any questions or feedback about the data overviews feature.
Happy data mapping!


.png)